Search This Blog

Calculation of Indicated and Effective Engine horse power using Indicator diagram, Fuel pump Index or Turbocharger speed


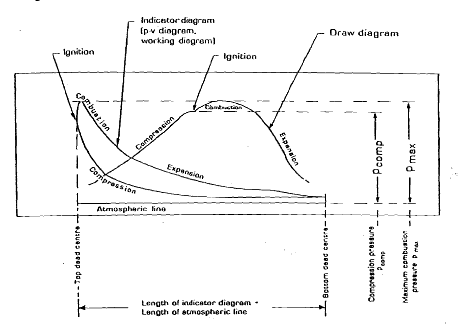
I) Calculation of engine Power with Indicator diagram

For engines with indicator drive or MIP-equipment, we can take the indicator diagram which can be used to find the Mean Indicated Pressure (MIP). Dont get confused between MIP and MEP. Former is the Indicated mean pressure while MEP is the effective pressure availabel after friction losses in the shaft.
Calculation of the indicated and effective engine power consists of the following steps:

Calculate:
- The mean indicated pressure, pi
- The mean effective pressure, pe
- The cylinder constant, K
- The indicated engine power. Pi
- The effective engine power, Pe
-The mean indicated pressure, Pi

Mean Indicated Pressure, pi 

Pi (bar) =   A  
               L x Cs
A  = A is the area of the Indicator diagram measured with a Planimeter in mm^2
Cs = Spring constant of the drive in mm/bar (vertical movement of the indicator stylus (mm) for a 1 bar pressure rise in the cylinder)
L = length of the indicator' diagram (atmospheric line)

The mean effective pressure, pe

(for BMW engines)
pe = pi - kt (bar)
where
kt = the mean friction loss
The mean friction loss has proved to be practically independent of the engine load. By experience, kt has been found to be:
S26MC: kt = 1.50 bar
L35MC: kt = 1.25 bar
S35MC: kt = 1.15 bar
L42MC:kt = 1.10 bar
S42MC: kt = 1.00 bar

Cylinder Constant, K

The cylinder constant, K is determined by the dimensions of the engine, and the units in which the power is
wanted.
For power in kW :  = 1,30900 x D^2 x S
For power in BHP :  = 1,77968 x D^2 x S
where:
D (m) = cylinder diameter
S (m) =piston stroke

The indicated engine power, Pi

Pi = K x n x pi (ikW or ihp)
where
n (rpm) = engine speed.

The effective engine power, Pe

Pe = K x n x pe (kW or bhp)
where
n (rpm) = engine speed.

This effective power is used to calculate the SFOC of the engine. Click here to know how to calculate  SFOC of engine 

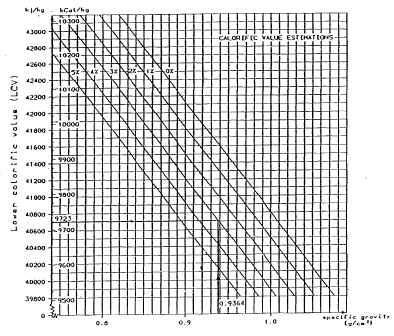
II) Power calculation without Indicator Diagram

The estimation is based on nomograms involving engine parameter measurements taken on testbed. the graphs are provided in the manual

1) Fuel Pump Index method

The fuel pump index is used to find out the mean effective pressure from the nomogram graph. Again form the graph, the mep at a specific speed gives the engine bhp. 

This method should only be used as a quick (rough) estimation, because the fuel oil, as well as the condition of the fuel pump, may have great effect on the index. In particular, worn fuel pumps or suction valves tend to increase the index, and will thus result in a too high power estimation. 

Chart I: draw a horizontal line from the observed fuel pump index to the nomogram curve, and then a vertical line down to the observed engine speed on Chart II. From this intersection a horizontal line is drawn to the effective engine power scale. (This method is specific for some engines. many other parameters are included to calculate the BHP in bigger engines)

This effective power is used to calculate the SFOC of the engine. Click here to know how to check the SFOC

So some factors are not included in calculating the BHP of the engine. Click here to view another example of BHP calculation using more parameters (will be updated soon).

(Graph is specific for a type of engine)

2) Turbocharger speed method

This method id more accurate than the Fuel pump index method. Chart III: draw a horizontal line from the observed tscav value and an inclined line from the observed turbocharger speed. From the intersection point, draw a vertical line down to the nomogram curve and then a horizontal line to the vertical tine from the observed ambient pressure (point x in the ambient pressure scale). Finally, a line is drawn parallel with the inclined 'ambient pressure correction' lines. The effective engine power can then be read on the scale at the right hand side, i.e. 8,000 bhp.

This effective power is used to calculate the SFOC of the engine. Click here to know how to calculate  SFOC of engine 

If you like our article, share it with your friends and VISIT OUR FACEBOOK PAGE AND LIKE IT (click here) to get all updates from us.

SFOC Calculation of a Diesel Engine - Specific Fuel Oil Consumption (gram / bhphour)

Calculation of the specific fuel oil consumption (g/kWh, g/bhph) requires that engine power, and the consumed fuel oil amount, are known for a certain period of time.  The engine power (in bhp or KW) can be calculated from the Indicator diagram or from Fuel Pump Index method or from Turbocharger speed. The oil amount is measured for a few hours to avoid calculation mistakes. The engine parameters shoudnot be changed during this period.  Since quantity measurements will be in volume units (m3), it will be necessary to know the oil density, in order to convert to weight units (gram). The density is to correspond to the temperature at the measuring point. Density can be calculated on the basis of bunker specifications. Density at 15 deg is available in the BDN (Bunker Delivery Note). The density at required temperature can be calculated with the density correction factor equation. But normally graphs are provided in the manual to find the density at required temperature, where the change in density is shown as a function of temperature.

Density correction graph

Calculation with an example
Effective Engine Power, Po - Say 8,130 bhp (Engine power is calculated from the performance sheet. It can be calculated from the Indicator digram or with fuel pump index or turbocharger method. All methods are explained below)
Consumption, Co - 3.83 m3 over 3 hours
Measuring point temperature - 119°C
Density at 119°C - Specific gravity 0.9364 t/m^3, 3% sulphur

SFOC =  Co x D119 x 10^6
                     h x Pe

where:
Co = Fuel oil consumption over the period (m^3)
D 119 = Corrected gravity (t/m3)
h = Measuring period, hours
Pe =Brake horse power, bhp
10^6 is multiplied to convert the fuel oil unit in tonnes to gram

3.83 x 0.8684 x 10^6      =     136.4 g/bhph
      3 x 8,130

Correction of LCV of Fuel Oil
In order to be able to compare consumption measurements carried out for various types of fuel oil, allowance must be made for the differences in the lower calorific value (LCV) of the fuel concerned. Normally, on the testbed, gas oil will have been used, having a lower calorific value of approx. 42,707 kJ/kg (corresponding to 10,200 kcal/kg). If no other instructions have been given by the shipowner, it is recommended to convert to this value. Usually, the lower calorific value of a bunker oil is not specified by the oil companies. However, by means of the graph given in the manual as a function of sulphur content and density at 15 deg C,  the LCV can be determined .  The corrected consumption can then be
determined by multiplying the "measured consumption

LCV 1
42,707

 LCV1 = the specific lower calorific value, in kJ/kg, of the bunker oil concerned

OR

LCV2
10,200

LCV2 = the specific lower calorific value, in kcal/kg, of the bunker oil concerned

Calculating LCV from the graph
LCV1, = 40,700 kJ/kg, derived from the graph given in manual

Consumption corrected for calorific value:

136.4 x 40,700 = 130.0 g/bhph
    42,707

Note - The ambient conditions (blower inlet temperature and pressure and scavenge air coolant temperature) will also influence the fuel consumption. Correction for ambient conditions is not considered important when comparing service measurements.

Click here to Know how to calculate the power from Performance sheet

If you like our article, share it with your friends and VISIT OUR FACEBOOK PAGE AND LIKE IT (click here) to get all updates from us.

Indicator Diagram and Draw Card - Information / Fault finding of Main Engine

Indicator and Draw Diagrams


The draw diagram is used for measuring the compression pressure and maximum pressure, and for evaluating the ignition characteristics of the fuel oil.

The indicator diagram (pv diagram: work diagram), illustrates the pressure variations in the engine cylinder as a function of the main piston position. The diagram area can, be integrated by means of a planimeter, and the mean indicated pressure calculated. (Used with engines fitted with indicator drive or MIP-equipmen)

Fault finding from Draw card/ Indicator diagram


Diagram 1
In diagram 1, Maximum pressure too low, but compression pressure is normal.
Fuel injection too late.
Fuel pressure too low.
Detective fuel valve(s).
Defective fuel pump suction valve.
Exceptionally poor Fuel (bad ignition properties)
Fuel pump lead too little.


Diagram 2

In diagram 2,  Maximum pressure is high, but compression pressure is normal.
Fuel Injection too early (Fuel pump lead too large)


Diagram 3

In diagram 3, Both Maximum pressure and compression pressure are low

Leakages, increased cyl. volume, or fouling.
Piston ring blew-by:
Exhaust valve seat leakage.
Piston crown burnt.
Low scavenge pressure.
fouling of exhaust and/or air system.

If you like our article, share it with your friends and VISIT OUR FACEBOOK PAGE AND LIKE IT(click here) to get all updates from us.


E-Pariksha Online exam qestions booklet (with answers) for Class 4 Marine Engineering Exam

We have released the new updated E-Pariksha online exam booklet with answers for class 4 marine engineers. We have collected 980 E-Pariksha Multiple Choice  Questions with their answers including Numericals of MET and Ship Construction (also diagram question). This 148 page booklet comes with a small price. We will courier you the booklet to your home address. To know more information on this booklet, Pls mail on meoclassivhelp@gmail.com  or https://www.facebook.com/messages/epariksha.classivexam with your name and phone number.

MEK (Motor)- 303 questions with answer
MEK (General) - 126 questions with answer
Ship Construction - 163 questions with answers
MEP - 121 questions with answer
MET - 74 questions with answers
Safety - 183 questions with answer

Click here to check some of the E-Pariksha questions.

mail on  - meoclassivhelp@gmail.com or https://www.facebook.com/messages/epariksha.classivexam with your phone number to get more information

Here are some pages from from the booklet


Difference between Circuit Breaker and Fuse


Circuit breaker:
Has switching actions to close the circuit or to open the circuit, and
has a trip circuit if load current exceeds the set value.
After tripping, circuit breaker can be reused without replacing any part.

Fuses:
Have only breaking function, and fitted in the circuit to protect the circuit from damaging effect of high current flow.
It breaks the circuit by melting the fuse metal itself.
After breaking, the blown fuse must be renewed.

Actions carried out when Electrical Machines (Motor) flooded with Sea Water

When Electrical Machine is flooded with SW:


  • Machine is disconnected from power sources and dismantled.
  • All salt deposits washed out with FW.
  • If deposited with oily bilge water, wash out with Electro Cleaner.
  • Should be heated with lamp, and enclosed or covered up to retain the heat.
  • Moisture should be escaped, by lifting the cover continuously or periodically.
  • Hottest part of the machine shall not exceed 90°C, while heating.
  • IR readings and temperatures taken regularly, until constant value reach about 1 m Ω.
  • Then, spray the machine with insulation vanish.
  • Assemble and put in service with low load, if possible.

Explain a Dashpot used as a Time Delay device in Over load trips

Dash pot:
Dashpots are fitted for overload trips to get time delay action, so that breaker will not be opened, due to momentary current surge.
When load current is in excess, it attracts plunger of the solenoid.
Plunger or piston moves up against the displacement of viscose oil or silicone fluid, through a small hole on the piston.
Time lag depends upon hole size, and viscosity of oil.
Load current setting for trip is about 25% above maximum, but should not exceed 50%.

Explain Shore connection onboard a ship with class requirements and regulations

Shore connection box is provided at convenient position, to receive shore power supply, so that ship’s generators can be shut down, in port or Dry Docking.

Lloyd’s Requirements:
Connection box contains a circuit breaker or isolating switch with fuses.
Provided full information of supply system, normal ship voltage and frequency for AC current.
Main Switchboard must be provided with a link switch or a circuit breaker, voltmeter, ammeter, and an indicator to show that the cable is energised.
For 3-phase supply with earth neutral, an earthing terminal must be provided, for connecting the hull to shore side.
A phase sequence indicator is necessary to ensure correct connections.
Means shall be provided for checking polarity, and terminals should be labelled.

What are Ship (Marine) Battery Room Safeties and Maintenance carried out

Battery room inspection and maintenance:
Battery installation and its charging rectifier checked.
Battery room environment must be dry and well ventilated.
Battery tops shall be clean and dry, and terminal nuts must be tight and a smear of petroleum jelly applied to prevent corrosion.
Electrolyte at proper level, and shall have correct value of specific gravity by checking with a hydrometer.
Rubber gloves and goggles used when handling electrolyte.
Charging equipment checked for dirt, overheating, loose connection and correct functioning of indicators.
Ventilation arrangement for battery locker checked. Battery installation of both lead acid and alkaline needs good ventilation.
Since both type generates hydrogen gas during charging, no smoking and naked light allowed.
Steel works and decks adjacent to lead acid battery, should be painted with acid proof paint.
[For Cad-Ni cell, alkaline resistance paints.]
Battery Room Safety Arrangement:

Safety is provided by:
Proper ventilation
Prevention of heat source for ignition.

Ventilation:
Independent exhaust fan provided.
Inlet duct should be below battery level, and outlet at top of the compartment.
Prevention of heat source for ignition:
No naked light and no smoking.
Uses of externally fitted light or flameproof light.
Cables of adequate size and they are well connected.
Never placed Emergency Switchboard in this room.
Use insulated spanner and plastic jug for distilled water, to prevent short-circuit.
Room temperature, maintained at 15 ~ 25°C.
Related Posts Plugin for WordPress, Blogger...